Soil Temperature Map for Morel Hunting Watch the ground warm into the mid-40s°F across Washington, Oregon, and the Western US
Studies elsewhere put morel fruiting onset in the mid-40s°F (43°F for a European morel, Buscot 1989); there is no Pacific Northwest study, and none for burn morels. Air temperature swings too fast to be a reliable signal on its own, and the ground lags behind it. The live map below estimates surface soil temperature across the West so you can see which elevations and aspects have crossed the threshold and which are still too cold.
This is one layer of about twenty
In Forayz you can stack soil temperature against burn perimeters, snow cover, recent rain, forest type, and public land boundaries — and zoom all the way in on a specific drainage.
How to Read the Map
The color ramp is built around the fruiting threshold rather than around a neutral temperature scale, so the interesting transition is easy to spot.
| What you see | Soil temperature | What it usually means |
|---|---|---|
| Deep blue | At or below 32°F | Frozen ground. Nothing is happening below the surface yet. |
| Blue | 32–40°F | Cold and thawing. Typically still weeks away in most habitats. |
| Green | 40–45°F | Approaching the window. Worth watching week to week. |
| Pale, near-transparent | About 45°F | The emergence band. Deliberately faint so you can see where it falls across the terrain. |
| Tan to warm brown | 50–70°F | Inside and then past the range morels are commonly reported fruiting in. |
| Deep maroon | 80°F and above | Hot. Spring morel season is over at that elevation. |
The threshold matters less than the trend
A single warm reading means very little. What foragers actually watch for is a region holding above the low-to-mid 40s for several days in a row, ideally after a wet stretch. Check the same area a few days apart — the direction of travel tells you far more than any one number.
Why Soil Temperature Beats the “Rule of 100”
A common forager rule of thumb is the Rule of 100: morels are likely to start fruiting once the daily high plus the daily low adds up to 100°F. Highs of 60°F and lows of 40°F make 100, which is another way of saying the average daily air temperature has reached 50°F. We have not found a published source for it.
It is easy to use, since it works from any weather forecast. But it has blind spots:
- It does not account for a brief warm spell in February followed by more snow or a hard freeze.
- It does not account for warm air over ground that is still under snowpack — the air can hit the number while the soil sits at 33°F.
- It treats a whole region as one number, when north-facing and south-facing slopes a mile apart can be weeks apart.
Soil temperature sidesteps all three, because it measures the ground itself, where the mycelium lives. It responds slowly to air temperature, which is exactly the property that makes it a better signal.
Track the same spot week over week
Forayz updates soil temperature daily and pairs it with snow cover and 7-, 14-, and 30-day rainfall, so you can tell a genuine warming trend from a two-day blip.
How Foragers Use This Map
Deciding whether it’s worth the drive. Before committing to a four-hour trip, check whether the soil at your target elevation has actually crossed into the tan band. If a burn is still showing blue, the drive can wait a week.
Following the season uphill. Spring morel season is a wave that climbs in elevation. Watching where the pale 45°F band sits, and where it sat a week ago, tells you which elevation band is coming into play next — and roughly how fast.
Finding the early edges. The first morels of the year tend to show up in warm micro-sites: low-elevation river bottoms, urban woodchips, south-facing ground near a wall or road cut. Those places cross the threshold first, and the map makes them easy to spot.
Knowing when to stop. Once a zone is running deep brown, spring morel season there is finished and it is time to move up in elevation or switch targets.
What this map can’t tell you
- It’s a model, not a thermometer. The values come from a global reanalysis dataset at roughly 9 km resolution. It is excellent for regional patterns and genuinely poor at the scale of a single hillside.
- It lags reality by several days. The underlying data publishes with a five-to-six day delay, so a sudden warm front will show up on the ground before it shows up here.
- Warm soil is necessary, not sufficient. Temperature is one of several conditions. Without moisture, the right host trees, and the right substrate, warm ground produces nothing.
- It says nothing about access. Warm soil on private land or behind a snowed-in forest road is not a place you can hunt.
What Pairs Well With It
Soil temperature answers when. It takes other layers to answer where:
- Recent rainfall — warm ground that has just been rained on is the combination worth driving to.
- Snow cover — tells you whether an area is even reachable yet, and where the snowline is sitting. See the morel elevation and snowline map.
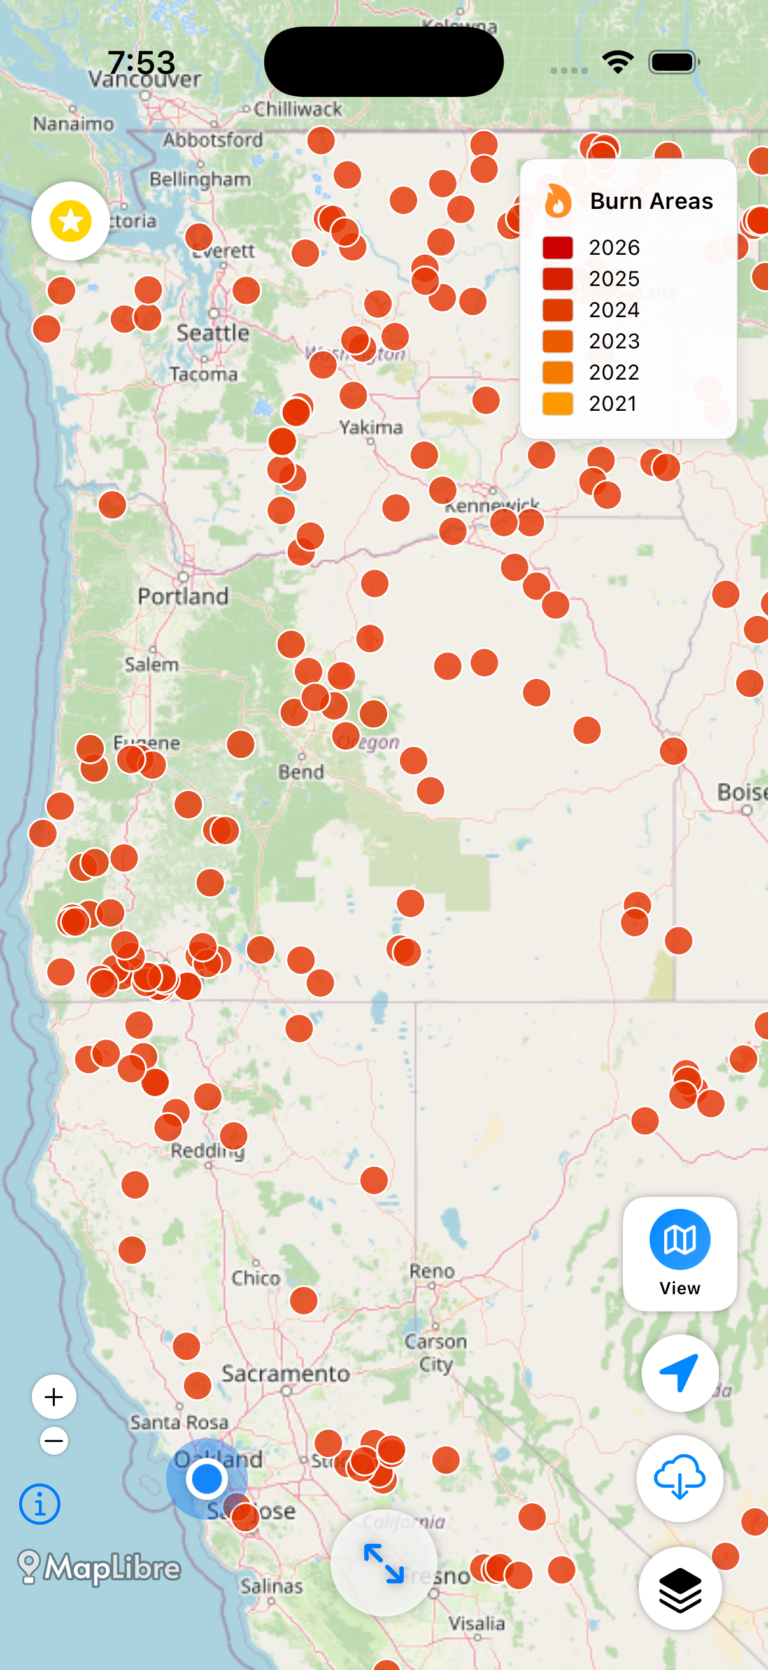
- Burn perimeters — first-year burns in conifer forest are the highest-yield morel habitat in the West.
- Forest type — cottonwood bottoms for spring landscape morels, conifer for burn morels.
- Public land boundaries — see where you can legally forage.
Where this data comes from
Soil temperature estimates come from ERA5-Land, a reanalysis dataset produced by the Copernicus Climate Change Service and ECMWF. The layer shows the 0–7 cm (roughly 0–3 inch) surface level at about 9 km resolution, refreshed every other day. Full source list on our data attribution page.
Get the Full Map
Forayz is a mushroom foraging map for the Pacific Northwest and the wider Western US. A registered account is free and includes soil temperature and moisture at two depths (at regional zoom), snow, the past 7 days of rain, wildfire smoke, ecoregions and public lands. Pro adds full-zoom soil detail, 14- and 30-day rainfall, the newest burn perimeters with burn severity, timber harvests, tree species density, area fruiting calendars, and offline downloads.
Get the data serious foragers use to find more mushrooms
Free members get soil conditions, the past week of rain, snow, smoke and historical burns. Pro unlocks the layers that help you narrow down exactly where to look.
- Newest burn years, managed burns & burn severity
- Tree species maps (22 species) & timber harvests
- Town and mountain pass fruiting calendars with current conditions
- Offline map downloads in the iOS & Android apps
- 14- and 30-day rainfall windows
- Soil temperature & moisture at full zoom